Market snapshot – figures below reflect trading activity as of early August 2026 and are cited for historical and educational context, not as live prices.
Early August 2026 gave traders a lot to unpack at once. The S&P 500 and the Dow Jones Industrial Average both closed at record highs, gold pushed past the $4,000 mark for the first time, and oil prices swung sharply on Middle East headlines. Snapshots like this one are useful less for the exact numbers, which move constantly, and more for the pattern behind them. These stock market trends 2026 illustrate how indices, gold, oil, and Fed policy tend to interact, a dynamic that repeats across market cycles even as the specific price levels change.
This is not a buy this now list. It is a framework for reading market signals in context, so the next headline you see makes more sense whenever you are reading this.
Stock Market Trends 2026: Records, Rallies, and What Drove Them
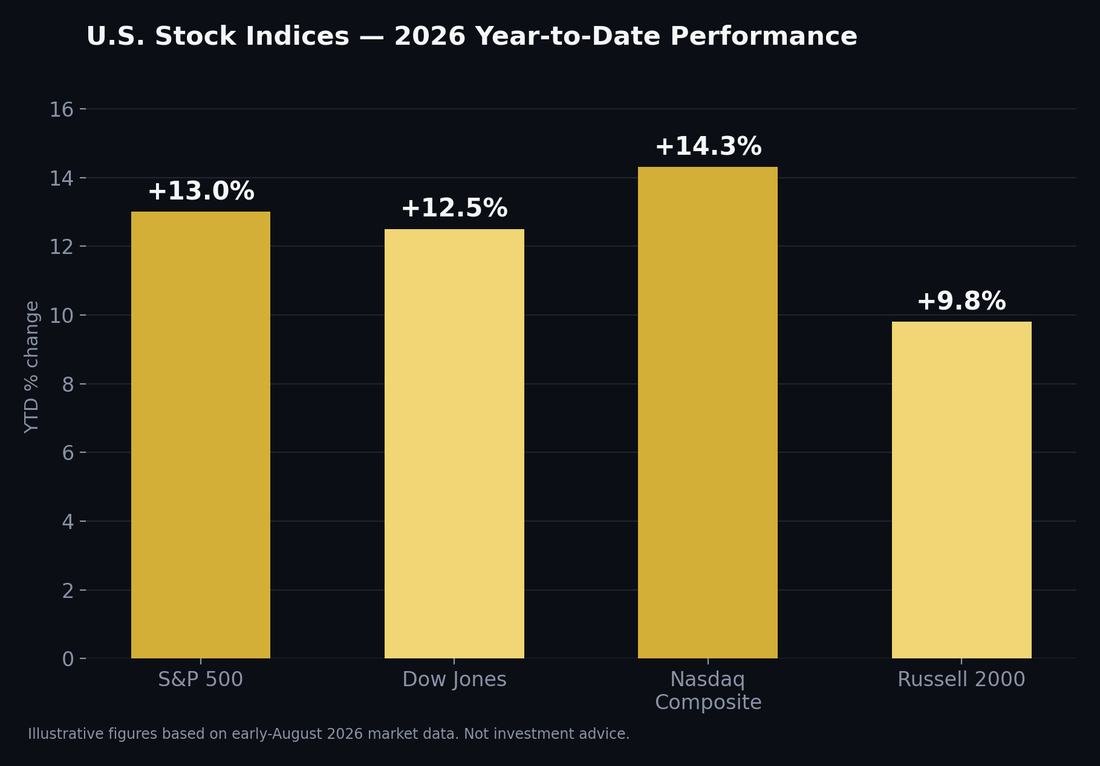
In early August 2026, the Dow closed above 54,000 for the first time, and the S&P 500 followed with its own record close, supported by a strong second-quarter earnings season. A large majority of S&P 500 companies that had reported by that point beat analyst expectations, with the beat rate running at its highest level in years. Technology and semiconductor names led the charge, with AI-related earnings from major players reassuring investors that demand for artificial intelligence infrastructure had not cooled off.
The Nasdaq Composite was the standout that period, up more than 14% year-to-date, while the more cyclical Russell 2000 lagged with a still-solid gain near 10%. That gap between mega-cap tech and small caps is itself a signal worth watching in any cycle: it shows where institutional money is concentrating.
Easing geopolitical tensions around the Strait of Hormuz also removed some of the risk premium that had weighed on sentiment through the prior month. When that kind of macro pressure lifts, it tends to show up first in broad market breadth, with advancing stocks outnumbering decliners by a wide margin, as they did that week.
Gold’s Rally Past $4,000: A Signal Worth Understanding
While stocks were celebrating record highs, gold quietly had one of its strongest runs in over a decade. The metal climbed from roughly $2,800 an ounce at the start of 2026 to more than $4,000 by August, a move driven by a mix of persistent inflation expectations, steady central bank buying, especially from China and India, and a softer US dollar.
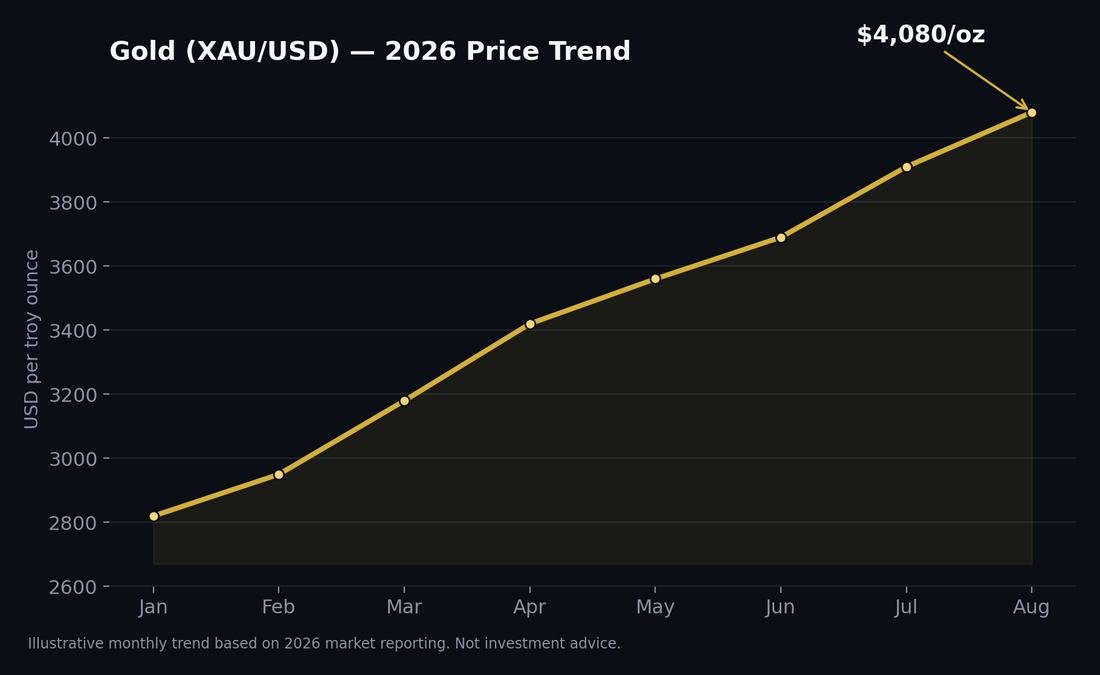
Gold’s relationship with real interest rates is one of the more reliable patterns in macro investing: when rates fall or inflation expectations climb, non-yielding assets like gold tend to become more attractive. That is part of why gold kept grinding higher even while equities sat near all-time highs, a combination that can look unusual until you factor in central bank accumulation and lingering geopolitical risk.
For traders, gold’s strength alongside record stock prices is a reminder that risk-on and safe-haven flows are not always mutually exclusive. Watching how the two move together, or diverge, says a lot about how confident the market really is at any given moment.
Oil and Commodities: Reading the Geopolitical Risk Premium
Crude oil told a very different story than gold that year. WTI crude spiked toward the $100 mark during the height of Middle East tensions, then fell back sharply as diplomatic talks around reopening the Strait of Hormuz gained traction. In the span of about a week, oil dropped more than 10%, extending a multi-session losing streak as optimism grew that a deal could reduce shipping disruptions.
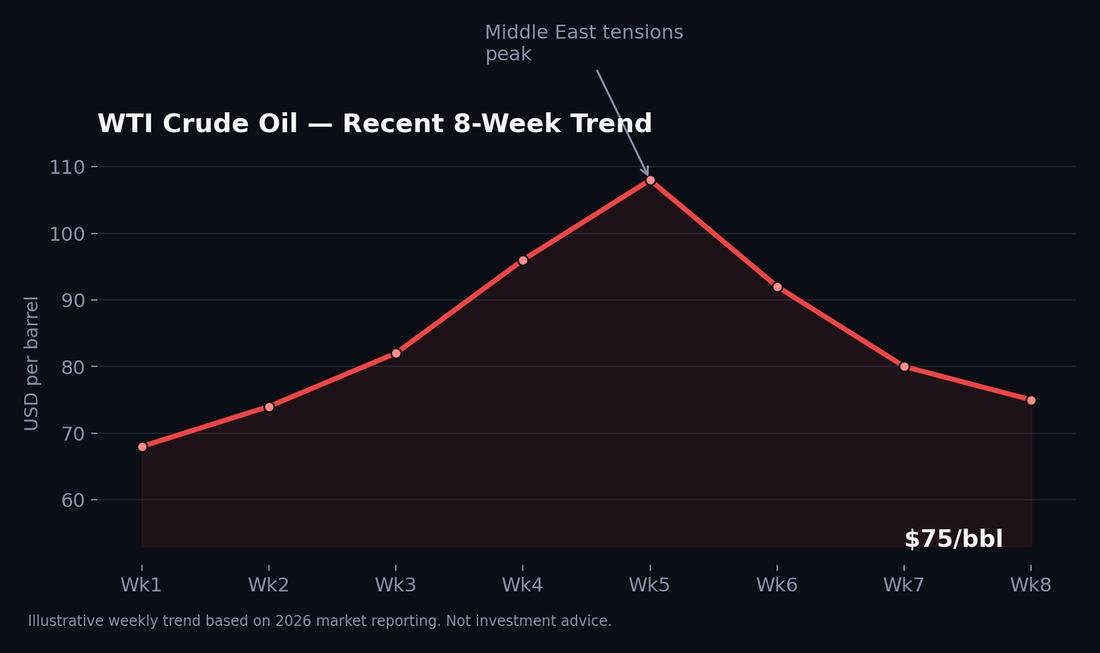
This kind of volatility is a textbook example of a geopolitical risk premium unwinding in real time. Oil traders are not just pricing in supply and demand, they are pricing in the probability of a shipping route staying open. When that probability shifts, prices can move fast in either direction, which is exactly why energy markets tend to see some of the sharpest short-term swings of any major asset class.
OPEC+ was also gradually restoring previously cut production during this period, adding another layer to the supply picture.
The Fed, Interest Rates, and the Next Catalyst
Behind all of this sat the Federal Reserve. Through mid-2026, the Fed held its benchmark rate steady at 3.50 to 3.75 percent across several consecutive meetings, even as a growing number of policymakers signaled openness to a hike if inflation did not cooperate, a notable shift from earlier in the year, when many economists had been penciling in cuts.
The next major catalyst was the FOMC meeting scheduled for mid-September, which would include a fresh Summary of Economic Projections. Markets were watching closely for any change in tone from the Fed Chair, particularly after a recent vote showed real disagreement among committee members about the path forward. Bond markets were already reacting: longer-dated Treasury yields pushed higher even as shorter-term yields eased, a divergence that usually reflects uncertainty about the Fed’s next move rather than confidence in either direction.
For anyone trading around Fed decisions, that kind of split reaction across the yield curve is often more informative than the headline rate decision itself.
How to Read These Signals Without Guessing
None of this, record index levels, gold near $4,000, oil’s sharp round trip, or a divided Fed, tells you what happens next. Markets move on new information constantly, and even a strong signal can reverse on a single headline. What these indicators are good for is context: understanding why a stock, a sector, or an entire index is moving the way it is, instead of reacting to price action in isolation.
That is the difference between trading off a hunch and trading off a process. Traders who consistently perform well tend to share one habit: they track the same handful of signals, index breadth, safe-haven flows, commodity swings, and central bank policy, every week, rather than chasing whatever is trending that day.
Turning Signals Into a Process
If you would rather not track index performance, gold, oil, and Fed policy across five different tabs every morning, that is exactly the kind of research TradeGrade’s analyst tracking and pre-market setup tools are built to simplify, grading upgrades, downgrades, and trade setups on a simple A+ to F scale so you can see the signal without digging through every report yourself.
Whatever tools you use, the goal is the same: fewer guesses, more process. Keep an eye on how we approach research at TradeGrade Research, and check back for how these dynamics evolve across future market cycles.
This article is for educational and informational purposes only and does not constitute financial, investment, or trading advice. Trading and investing involve substantial risk of loss and are not suitable for every investor. Past performance and historical price levels are not indicative of future results. Always do your own research and consult a licensed financial advisor before making investment decisions.