Quick Answer: a stock can fall after good earnings because markets are forward-looking. The latest quarter tells investors what already happened; guidance, analyst estimate revisions, and valuation assumptions tell them what may happen next. If the future outlook is weaker than investors expected, the stock can drop even when reported revenue, profit, or cash flow improved.
Why Good Earnings Can Still Be Bad News for a Stock
One of the most confusing moments for a newer investor happens during earnings season: a company reports numbers that look strong, the headlines say revenue grew, losses narrowed, or earnings beat estimates — and the stock falls anyway.
It can feel irrational. It usually is not.
A stock price reflects what investors believe a company will earn in the future, not just what it earned in the most recent quarter. That means a company can deliver a respectable set of historical results and still disappoint the market if its forward outlook is weaker than what investors had already priced in.
This is why experienced investors read an earnings release in layers. The reported quarter matters. But so do guidance, customer trends, margins, management commentary, analyst revisions, and the valuation the stock carried before the announcement.
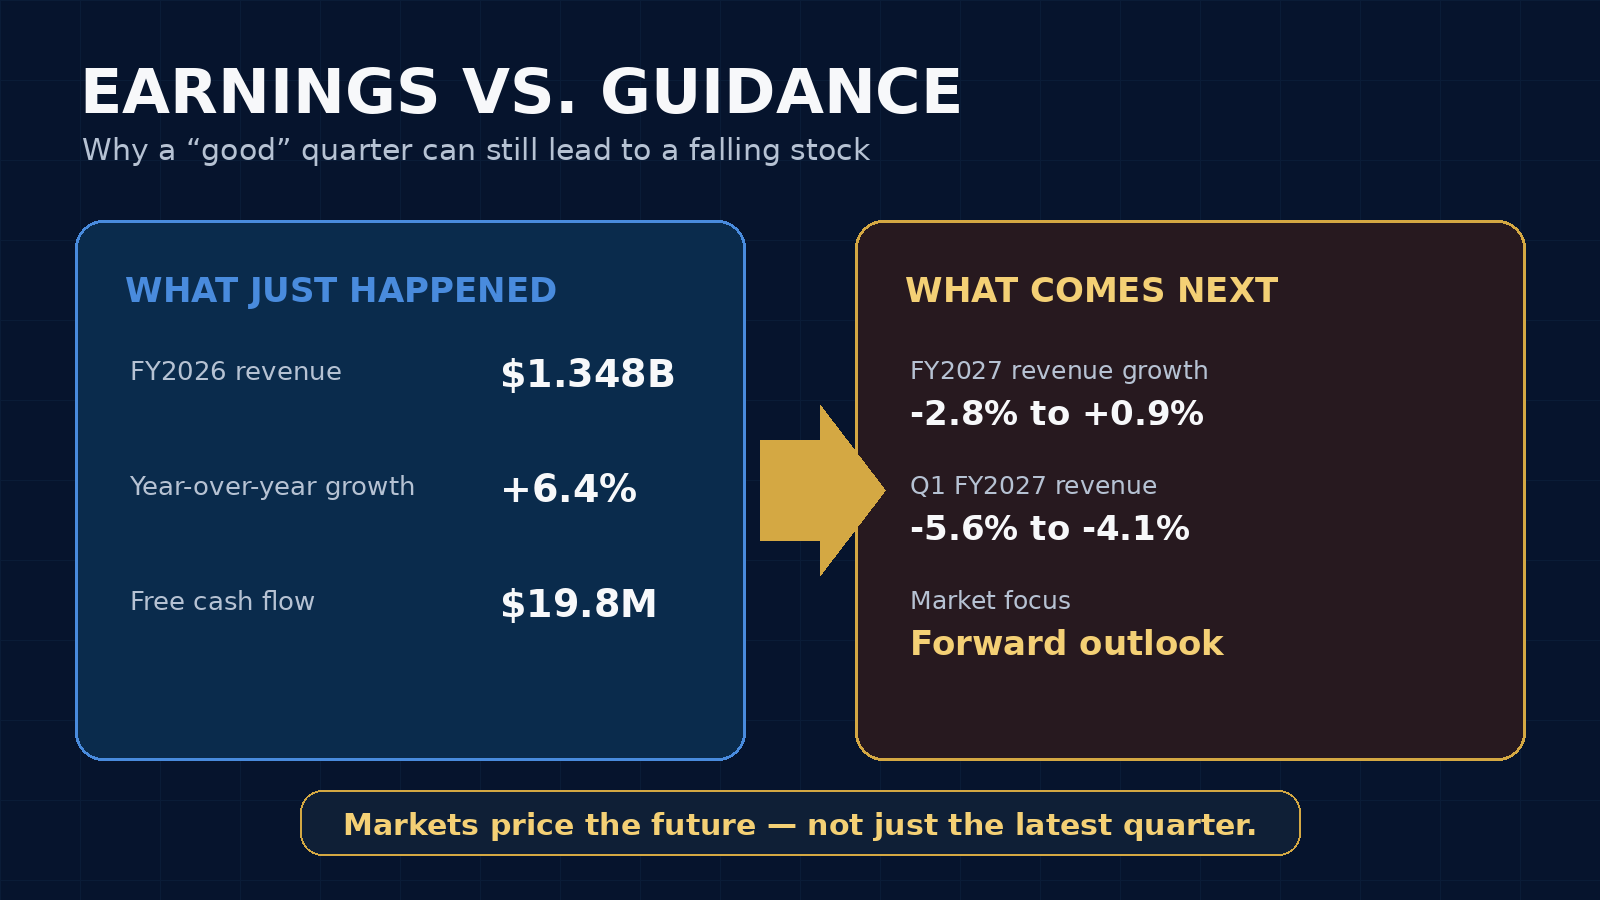
The Stitch Fix Example: Stronger Past, Weaker Forward Outlook
Stitch Fix provides a useful real-world example because its fiscal 2026 results contained several genuinely positive items. According to the company’s September 23, 2026 earnings release, full-year revenue reached $1.3481 billion, an increase of 6.4% from the prior year. The company reported a net loss of $12.6 million, adjusted EBITDA of $53.4 million, operating cash flow of $39.1 million, and free cash flow of $19.8 million. It also ended the year with $220.9 million in cash, cash equivalents, and investments and no debt.
Those figures can reasonably look encouraging at first glance. Revenue grew. The business generated positive free cash flow. The balance sheet had liquidity. Yet investors did not stop at fiscal 2026.
Management’s fiscal 2027 outlook called for revenue of $1.31 billion to $1.36 billion, equal to approximately -2.8% to +0.9% year-over-year growth. For the first quarter of fiscal 2027, the company guided revenue to $323 million to $328 million, implying a decline of roughly 4.1% to 5.6% year over year.
The lesson is not that the company’s reported results were secretly bad. The lesson is that the market was evaluating two different time periods at once: the year that had just ended and the year that was about to begin.
Earnings Tell You What Happened; Guidance Tells You What Management Sees Next
Reported earnings are backward-looking. They describe a completed period. Revenue, earnings per share, gross margin, operating margin, cash flow, and customer metrics tell you how the business performed during that quarter or fiscal year.
Guidance is forward-looking. It is management’s estimate of future revenue, profit, margin, cash flow, or other operating metrics. Companies do not always provide formal guidance, and the amount of detail varies, but when management does provide it, investors pay close attention because those forecasts affect expectations for future earnings.
Imagine a company reports revenue growth of 10% for the latest quarter. That sounds good. But suppose investors expected growth to accelerate to 15% next quarter and management instead guides to 5%. The quarter that just ended can be strong while the outlook is disappointing.
The reverse can also happen. A company can report a weak quarter but issue guidance suggesting that conditions are improving faster than expected. In that situation, the stock may rise despite ugly historical numbers.
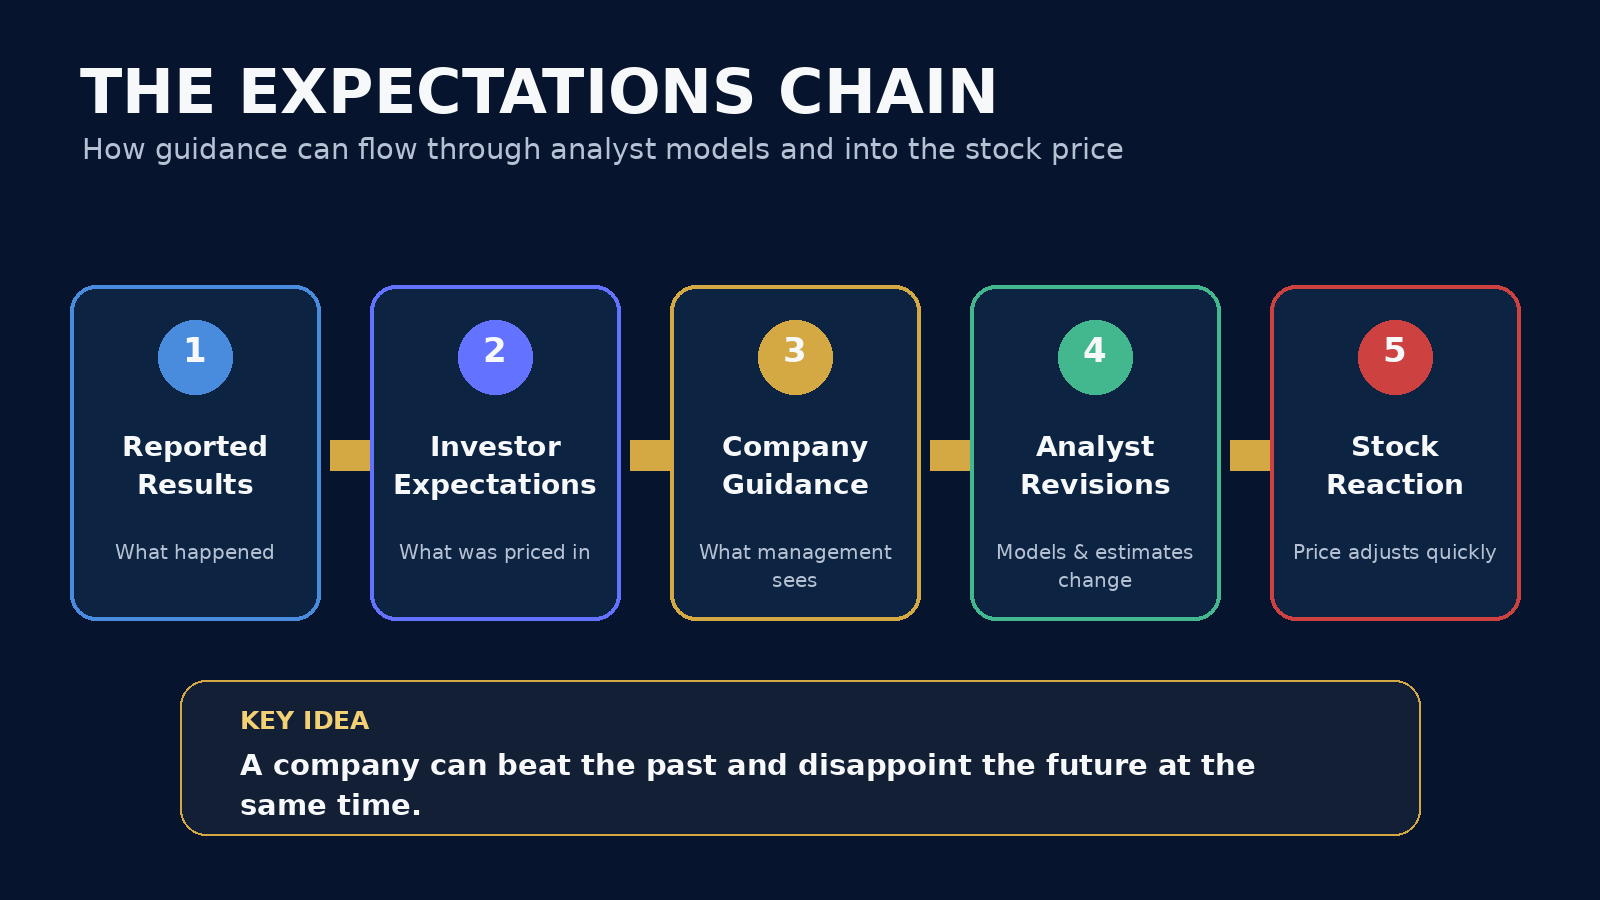
The Expectations Chain: Why the Reaction Can Be So Fast
The market reaction after earnings can be understood as a simple chain:
- Reported results: investors compare the latest numbers with prior periods and published estimates.
- Investor expectations: the market considers what was already priced into the stock before the report.
- Company guidance: management provides new information about future conditions.
- Analyst revisions: analysts update revenue, EPS, cash-flow, margin, and valuation models.
- Stock reaction: the market reprices the shares based on the new set of expectations.
This is also why a headline such as “Company Beats Earnings Estimates” is incomplete. A beat only tells you how the reported number compared with one benchmark. It does not tell you whether guidance disappointed, whether margins deteriorated, whether customer growth weakened, or whether investors expected an even bigger beat.
Guidance Can Change Valuation Even if the Latest Earnings Do Not Change
Valuation models depend on the future. A discounted cash flow model estimates the present value of future cash flows. A price-to-earnings approach often applies a multiple to expected future earnings. Revenue multiples, EBITDA multiples, and other methods also depend on future operating assumptions.
When guidance weakens, analysts may reduce forecasts for future revenue or earnings. That can lower a calculated fair value even if the historical quarter remains unchanged.
Consider a simplified example. If an analyst expected a company to earn $2.00 per share next year and valued it at 20 times earnings, the implied value would be $40. If new guidance causes the analyst to reduce the earnings estimate to $1.60 and the multiple remains 20, the implied value falls to $32. Nothing changed about the quarter that already happened. The estimate of the future changed.
This connects directly with our guide on how to read price target changes. A price target adjustment is often the visible result of changes that happened earlier in the model: revenue assumptions, margins, earnings, cash flow, risk, or the valuation multiple itself.
Why Expectations Matter More Than Headlines
Stocks do not trade on good versus bad in isolation. They trade on better or worse than expected.
A company can grow revenue 20% and still disappoint if the market expected 30%. Another company can report a 5% revenue decline and rally if investors feared a 15% decline. This is why the same headline number can produce completely different reactions for different companies.
Expectations can also become demanding when a stock has already risen sharply before earnings. A high valuation may imply that investors expect fast growth, expanding margins, strong customer retention, and optimistic guidance. Even a respectable report can fail to clear that high bar.
For a retail investor, the practical takeaway is to ask what the market was expecting before the release. Look at consensus estimates, prior guidance, recent analyst revisions, the stock’s valuation, and management’s earlier comments. Then compare the new information with that baseline.
Not Every Weak Guidance Number Means the Business Is Broken
Weak guidance deserves attention, but it also needs context.
In the Stitch Fix release, management explained that Q1 fiscal 2027 revenue was affected by two specific factors. First, the company changed the timing of some Fix shipments, shifting some volume from Q1 into Q4 fiscal 2026. Second, an unintended change to the post-checkout offer flow limited the number of clients eligible to request another Fix. Management said that issue had been corrected and would not affect results beyond the first quarter.
Those explanations are important because investors should distinguish between a temporary timing or execution issue and a structural deterioration in demand.
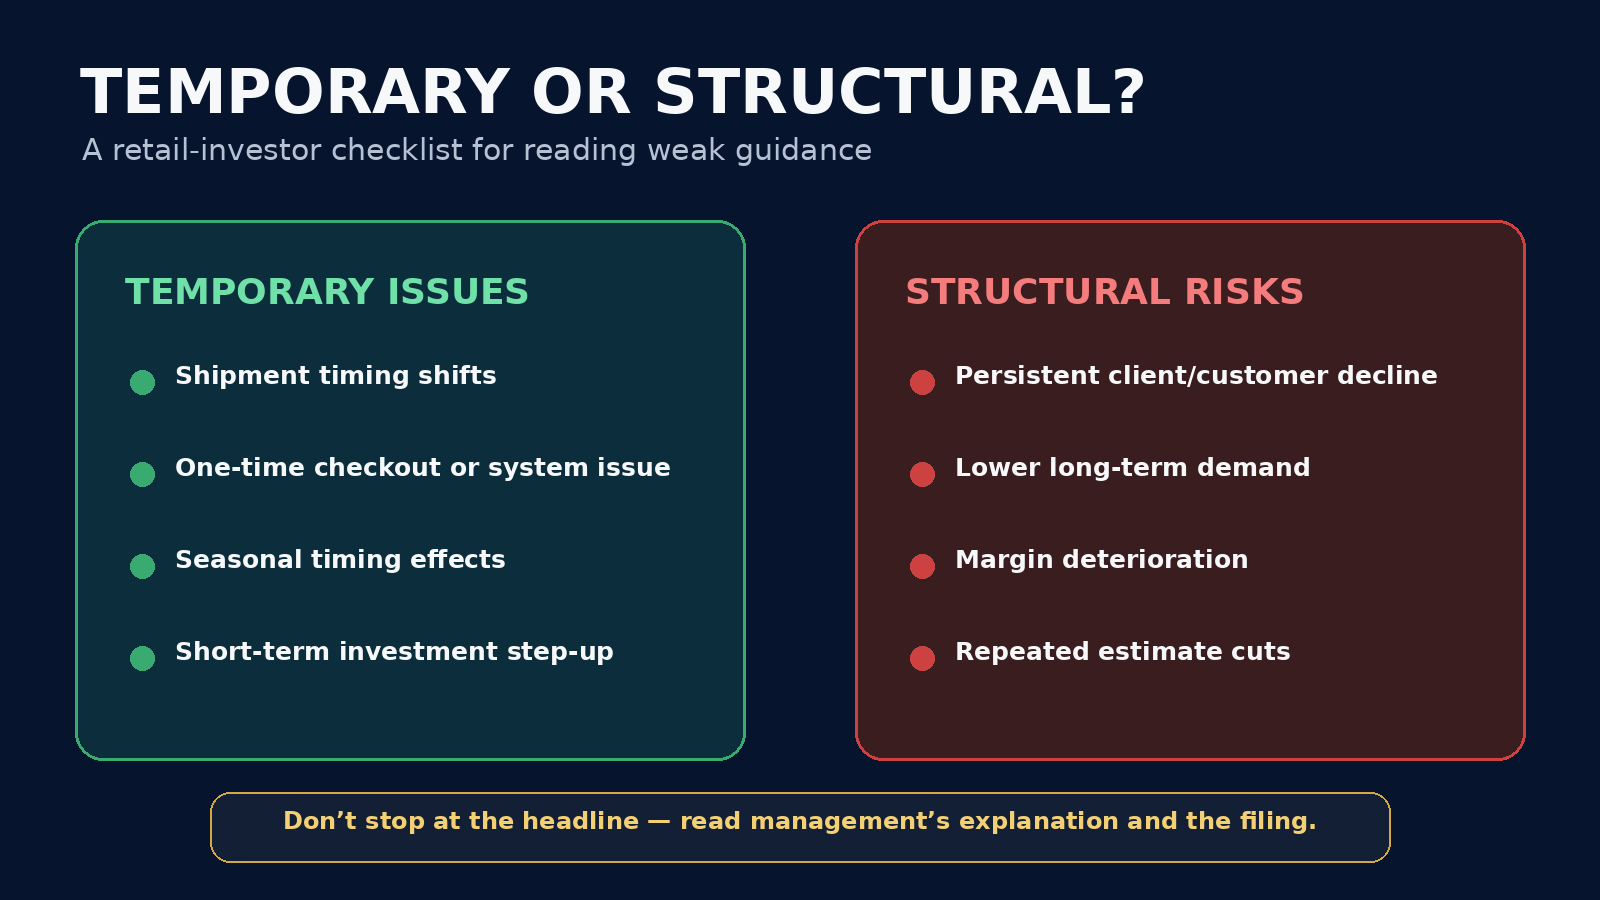
How to Separate Temporary Problems From Structural Risks
When management explains weak guidance, do not automatically accept or reject the explanation. Test it over time.
Potentially temporary issues
- Shipment timing that moves revenue between quarters.
- A one-time website, checkout, or systems problem that management says has been corrected.
- Seasonality or calendar effects.
- Short-term spending on marketing, technology, or capacity that management expects to generate future benefits.
Potentially structural issues
- A persistent decline in customers, subscribers, or active clients.
- Lower demand that continues across several quarters.
- Gross-margin or operating-margin deterioration without a credible path to stabilization.
- Repeated reductions to guidance.
- Growing competition that changes pricing power or customer acquisition economics.
The distinction matters because a temporary issue may affect one or two quarters while leaving the long-term earnings power of a business largely intact. A structural issue can change the entire valuation framework.
A 7-Step Earnings Checklist for Retail Investors
- Read the reported results. Revenue, EPS, margins, cash flow, balance sheet, and major operating metrics.
- Compare results with expectations. Was the beat or miss meaningful?
- Read the guidance. Compare it with prior guidance and consensus expectations.
- Identify what changed. Demand, pricing, customer counts, margins, costs, or timing?
- Read management’s explanation. Temporary issue or structural trend?
- Watch analyst estimate revisions. Future revenue and EPS changes often explain subsequent price-target changes.
- Revisit valuation. Ask whether the price still makes sense under the new assumptions.
Why Analyst Price Targets Often Change After Earnings
An analyst’s price target is not simply a reaction to whether management “beat” or “missed” the latest quarter. Analysts typically update a model after new information arrives.
If guidance implies slower growth, an analyst may cut future revenue estimates. If margins are expected to compress, future EPS estimates may fall. If the business appears riskier, the analyst may apply a lower valuation multiple. Any of those changes can reduce a price target.
This is why reading the reasoning behind a target change matters more than memorizing the target itself. A target can move because of earnings estimates, valuation multiples, risk assumptions, capital allocation, or a combination of several factors.
What Primary Sources Should Investors Read?
For earnings analysis, start with primary documents whenever possible. In the Stitch Fix example, the most useful sources are the company’s official earnings release and its SEC filing.
- Stitch Fix Form 8-K filed with the SEC
- Exhibit 99.1 — Fiscal 2026 earnings release
- Stitch Fix Investor Relations — FY2026 results
Secondary news sources can help explain the market reaction, but the underlying numbers, guidance ranges, and management commentary should be checked against the filing or investor-relations material.
Frequently Asked Questions
Why does a stock fall after beating earnings?
Because the market may have expected an even stronger result, guidance may be weaker than expected, margins may be deteriorating, or analysts may reduce future estimates. A historical earnings beat does not guarantee a positive stock reaction.
Is guidance more important than earnings?
Neither is always more important, but guidance can dominate the reaction when it materially changes expectations for future revenue, earnings, margins, or cash flow. The importance varies by company and situation.
Can a stock rise after missing earnings?
Yes. If the miss was already expected and management provides better-than-feared guidance, the stock can rise. Markets react to the gap between reality and expectations.
What should I look for in company guidance?
Look at revenue growth, margins, earnings, cash flow, customer or subscriber trends, capital spending, and any change from prior guidance. Also read the assumptions and management’s explanation rather than focusing only on the headline range.
Does weak guidance always mean the business is deteriorating?
No. Weak guidance can reflect temporary timing issues, seasonality, one-time disruptions, or deliberate investments. The important question is whether the issue persists and whether management’s explanation is supported by subsequent results.
Bottom Line
The stock market is a forward-looking discounting mechanism. That is why “good earnings” and a falling stock are not necessarily contradictory.
The latest quarter tells you what happened. Expectations tell you what investors had already assumed. Guidance gives the market new information about what may happen next. Analysts then revise models, and stock prices respond.
For retail investors, the most useful habit is to move beyond the headline. Read the earnings release, read the guidance, compare it with prior expectations, understand what changed, and decide whether the issue looks temporary or structural.
That process will not make every earnings reaction predictable. But it will make those reactions far easier to understand.
Want to study how analyst grades fit into a research workflow? Explore the free analyst grades training. Evaluate the methodology against your own objectives and risk tolerance.